Paginated report
Reporting paginated reports consist of multiple pages with fewer visualization elements used to display information in form of data or tables. Paginated reports are done in pages in the Report designer. The paginated report panel is created in the Report designer, and viewed in the preview panel in the Report designer, or in the Report viewer. Creating a paginated report, and organizing data display in it, is based on using Bands.
Paginated report bands
Bands are used in paginated reports to separate the report into functional units that share some common properties.
There are several different types of bands available, that cover most of the usual needs for creating reports:
- Report Title: Used to output the report title. It is rendered at the beginning of the report.
- Report Summary: Used to output summary data throughout the entire report. It is rendered once at the end of the report.
- Page Header: Used to output the page header or footer, i.e. page numbers, dates or other additional information. It is rendered on the top/bottom of each page.
- Group Header: Basic (minimal necessary) band for rendering reports with grouping. The distinctive group information components are placed in the group header. Usually they contain the group name, dates, conditions of grouping or similar information. This band is rendered once at the beginning of each group.
- Group Footer: Used to display the group footer information. It is placed after the relevant Data band, which needs to be paired with a corresponding Group Header. Unless the Group Footer is linked to a corresponding Group Header (numbered automatically when added to the page), it will not be displayed.
- Header/Footer: Used to output a custom header or footer. It is used with an individual data band.
- Column Header/Footer: Used to output column headers and footers. It is rendered only once, but all the contained components are printed above or under each column.
- Data: Connected to a data source and is printed as many times as there are available rows in the data source.
- Hierarchical Data: Connected to a data source and is printed as many times as there are available rows in the data source. The data is structured in a tree form.
- Child: Can be used to print two bands on one data row.
- Empty Data: Used to fill free space on the bottom of the page. It fills free space on each page of the report.
- Overlay: Used to print watermarks on the page.
Different band types are marked by different colors and automatic naming conventions. Some elements are automatically placed in a logical position when placed onto a page. For example, a Report Title band will always be placed on top of a page, or a Page Footer band will always automatically be placed at the bottom of a page.
Bands use overview
In the following example, the Paginated report DEMO is used to illustrate band usage. For details on designing this type of report please refer to the Paginated report example section of this Guide.
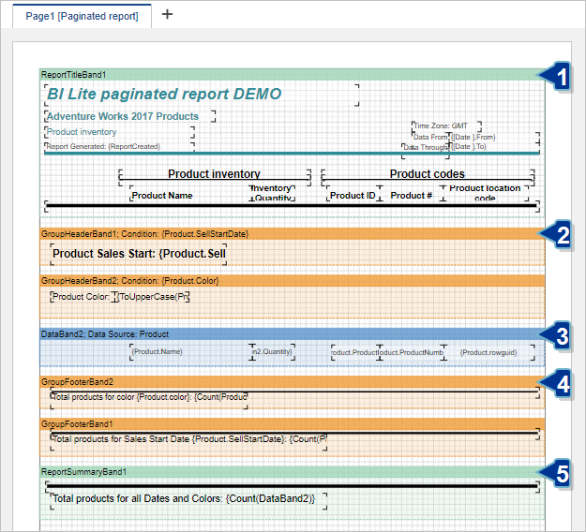
These are the standard band types and their use:
- The top of the page presents a turquoise Title band. It displays general report information and descriptions of the displayed data (category names).
- Following is a pair of ocher Group header bands. The example report includes two-level grouping - by Date and by the Product Color category. The group headers are numbered in the order of adding to the page, and their label includes the grouping condition.
- The light blue Data band is placed under GroupHeaderBand2 and is therefore named DataBand2. The label also includes the relevant data source used to fetch the displayed data. The data band is directly linked to GroupHeaderBand2. However, it is also indirectly linked to GroupHeaderBand1 which encloses both GroupHeaderBand2 and DataBand2. This results in the two-level grouping described in the previous point.
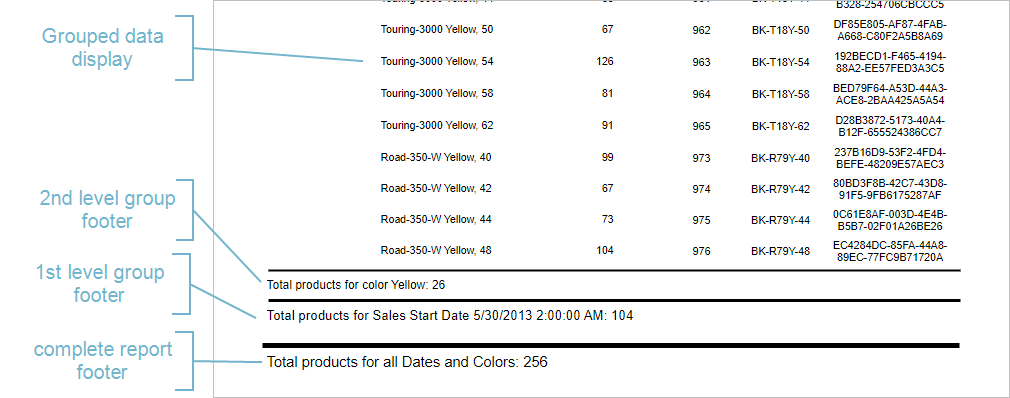
- The following ocher Group Footer bands are used to print summary information for the second and first level of grouping. They are directly linked to the corresponding Group Header bands (same numeration). The GroupFooterBand2 summary information (grouping by color) is printed for each color group separately, while the GroupFooterBand1 summary information is printed for each separate date, which includes all the colors available for that date.
- Finally, the green ReportSummaryBand1 displays summary information for the complete report (including all colors over all dates).
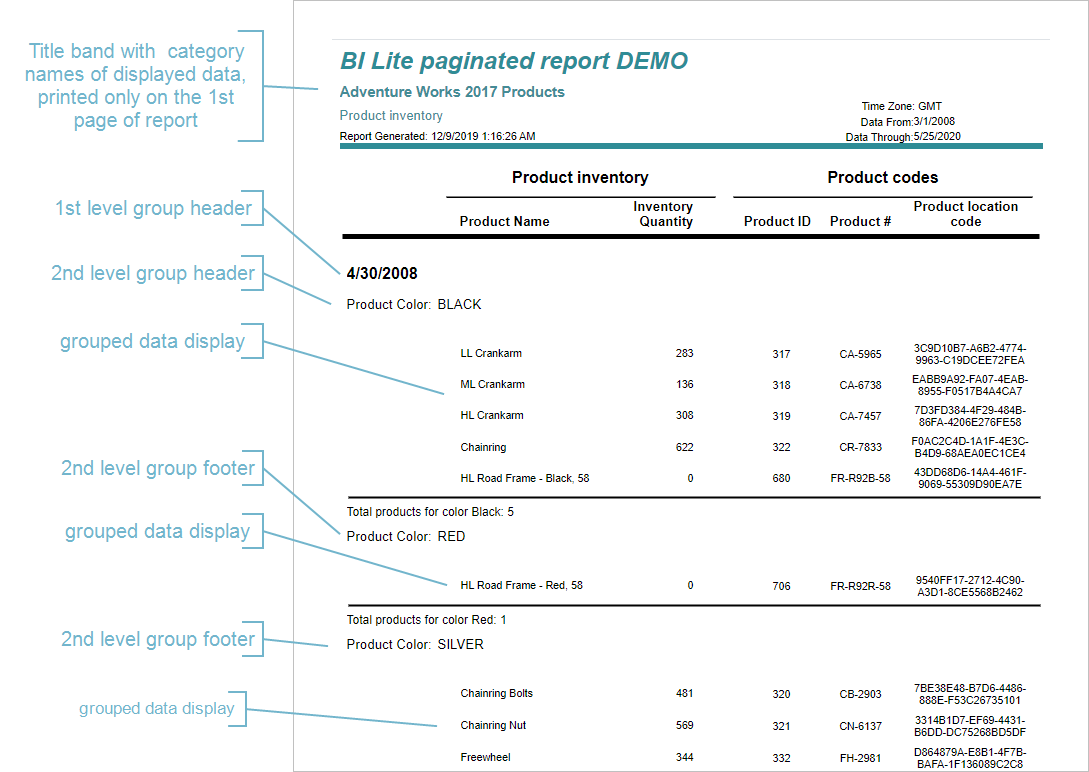
The resulting report first page section looks like this:
A section of the report's last page displays the rest of the report components, such as group and report footers: