Report designer
The Report Designer is a part of Reporting dedicated to the creation, modification and publishing of visual and paginated reports.
In this section, you can find:
- Key features and tools of the report designer
- Components needed to create reports.

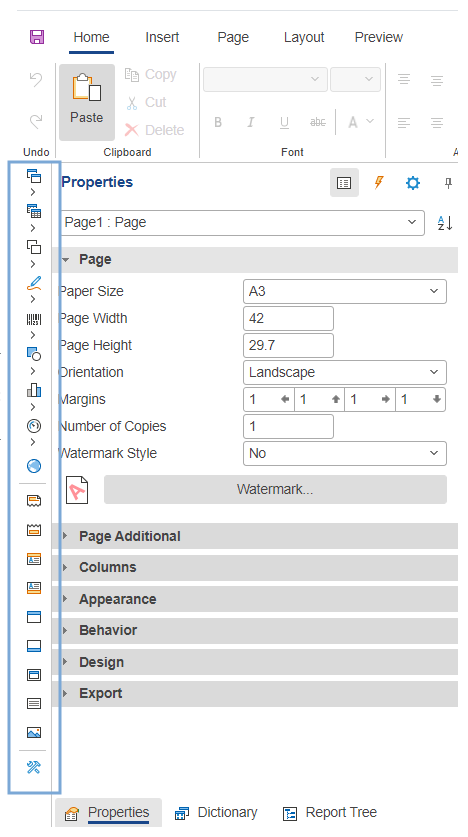
The report designer provides five different toolbar tabs in the upper part of the screen: Home, Page, Layout, Insert and Preview. Many of the options included therein are similar to options found in standard text-editing software.
|
Note All options are object-dependent and not all of them may be available for your current selection. |
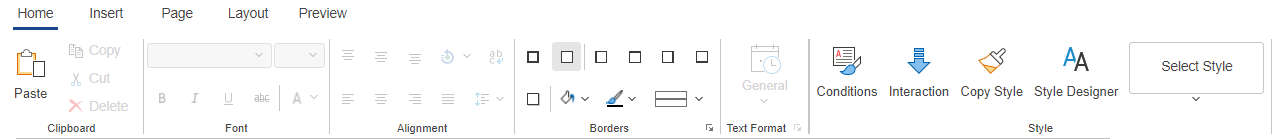
- Home: This tab contains typical customizing tools arranged into categories:
- Clipboard: Contains basic actions, such as Paste, Copy, Cut and Delete.
- Font: Edit font stylization, such as the selection of the font, the size, and other decorations (e.g., bold).
- Alignment: Define the alignment of the text and other elements. Includes additional options, such as word wrap and spacing.
- Borders: Adjust the borders of the report components, including their color and type, or add a shadow to a component.
- Text Format: Change the format of the text in your report to visualize it as needed, such as a string, currency, date, or other formats.
- Style: Working with report component styles. Described in more detail in Styles.
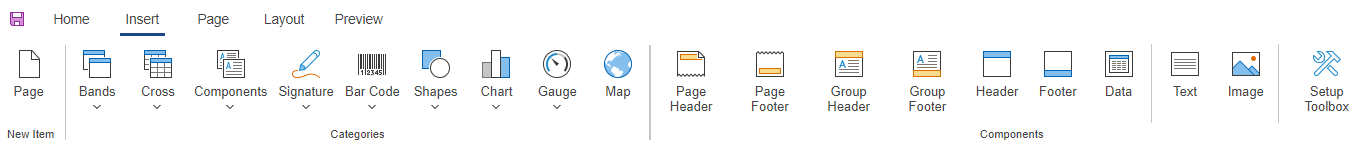
- Insert: Contains the objects that can be added to your report. These are explained in more detail in Paginated report.
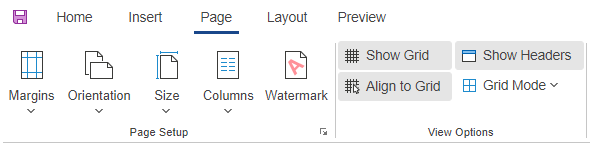
- Page: This tab contains options important for the print page setup, as well as View Options for dashboard editing.
- Margins: Specify the margins of your (printed) report.
- Orientation: Define the paper orientation of your (printed) report.
- Size: Choose the size of your report. You can select one of the predefined paper sizes or specify a custom one.
- Columns: Select up to three columns for your report.
- Watermark: Set up a watermark and its settings for the report.
- Show grid: Choose whether you want to show the grid in the background of the report. Useful e.g. for aligning elements.
- Show headers: Choose to show or not show header bands placed in the report.
- Align to grid: Toggle on to automatically snap all components to the grid lines.
- Grid mode: Choose between showing a grid with lines or dots.
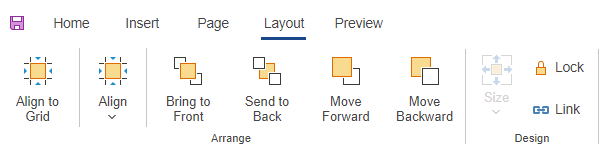
- Layout: Tools for precise object positioning in your report. If you select multiple components, you can use the Size option to adjust the sizes to be the same as the first selected component.
- Preview: Allows you to preview and check the look of your design for the report as the end-user will see it, without all the toolbars and designer options.
|
Note The only significant difference between the Preview view and an end-user's view is the Filters pane, which is located on the right hand side of the screen for the viewers, but in Preview mode it is shown on top of the report screen. Some background functions are also affected, as mentioned in previous chapters. |
In the top right corner of the Report Designer, there is ![]() View report. This opens the report in the form that the end-users and Viewers see it in (as opposed to a preview).
View report. This opens the report in the form that the end-users and Viewers see it in (as opposed to a preview).
To save a newly created report or modifications of an existing one, click Save  at the top left-hand corner of the Report designer.
Report designer pane
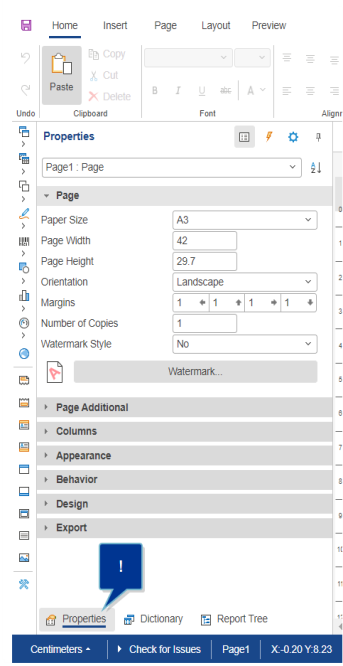
The Report designer includes a special pane covering additional options needed for report design. The pane is located on the left-hand side of the window and its three tabs are in the bottom of the pane.
The pane consists of these three tabs: Properties, Dictionary and Report Tree.
- Properties: This tab provides access to contextual properties for the selected objects, or the dashboard/page properties if none of the objects are selected. The editable properties listed in this tab vary depending on the selected object. To select an object, locate it in the dropdown menu in the top part of the Properties pane.
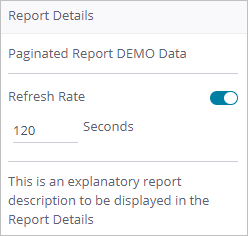
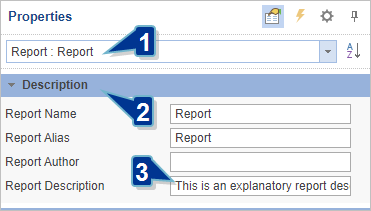
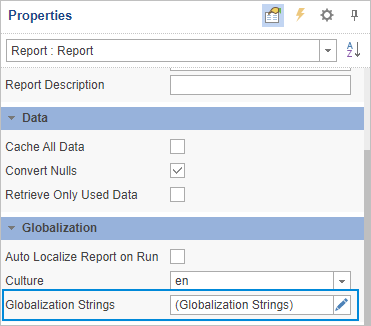
To enter a report description (to be displayed for viewers in Report Details), do the following:
- In the dropdown menu in the Properties tab, navigate to the top-level report and click it.
- Select the Description section.
- Enter an appropriate description for the report in Report Description.
- Dictionary: Shows the connected data, available data sources, system variables and functions as they are shown in the data model editor, provided appropriate permissions are given to the Designer of a report. To read more about the options available in the Dictionary, see Dictionary.
|
Note Some options described in Dictionary may not be available withing the Report Designer, as they are actions performed by Data Designers. |
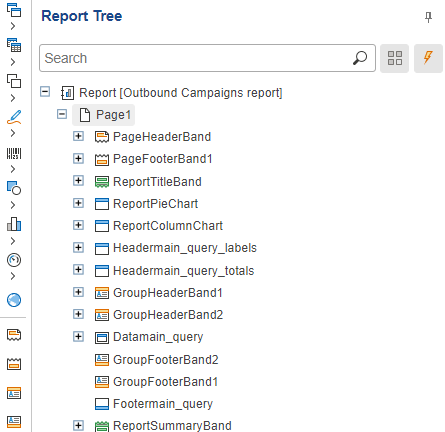
- Report Tree: Shows the hierarchy of the report. All the components of a report are shown in the form of a tree hierarchy. In addition, if an event handler is added to the component, it will also be displayed in the hierarchy of the report.
Localization of the static report parts
The static parts of the report can be localized by translating them using an additional table. This table is included in the data model as an extra resource. Individual elements suited for localization can be identified through the Globalization editor located in the Designer pane under Properties.
To partially automate the localization, the _reportViewerLanguage variable can be used. The output data needs to be joined with the additional translation table in order for it to be translated.
A query that includes the translation of the productivity field using an extra resource_bundle translation table would take the following form:
SELECT
IFNULL(rb.value, p.productivity) AS productivity
FROM productivities AS p
LEFT JOIN resource_bundle AS rb ON rb.string_id = p.productivity
AND rb.language = '{ _reportViewerLanguage }'
Report designer toolbox
The Report designer also includes a Toolbox on the left side of the window which is used for quicker access to data visualization elements, data bands etc. The Toolbox is located next to the Designer pane, on the left edge of the window.
Through the Toolbox, you can quickly add visualization or band elements to your reports. To use an element, drag it from the Toolbox into your active page or dashboard and place the element.
The Toolbox can also be customized to show the tools you choose. To do this, follow these steps:
- Click Setup Toolbox
 in the Toolbox itself or in the Insert tab of the Report designer.
 - A new window opens, showing you a list of options for the Toolbox. Select the checkboxes next to the tools and visualization elements you want to be displayed in the Toolbox.
- You can also choose to not show the Toolbox or the Insert tab here by clearing the Show Toolbox or Show 'Insert' Tab checkboxes.
|
Note You cannot clear both the Show Toolbox and the Show 'Insert' Tab check boxes. If one is already cleared and you attempt to clear the other, the first is automatically checked again. |
- To confirm your choice, click OK. The various tools and options will be displayed depending on whether you currently have a page or a dashboard tab open.
View report
When viewing the report from the Viewer perspective, additional options are available via buttons at the top right corner of the Report window:
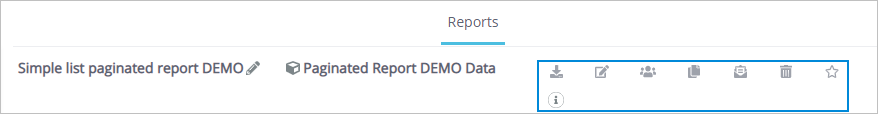
The availability of the buttons depends on the user's access level for the report.
-
 Edit: Return to the Report Designer view.
 -
 Share: Manage report access for other users (viewing, editing or ownership transfer). See more in Report and report view sharing.
|
Note In order for other users to generate a report, the relevant data model (for the report) also needs to be shared with them on the same level as the report. This is done by Administrators or Data Designers. |
-
 Duplicate: Produce a copy of the current report. If you wish to use a report as the basis for another one, or you want to let someone else use it while preserving the original, you can make a duplicate of the report and change it as needed, or transfer ownership of the copy to other users. A copy requires a unique name. By default it retains the same name with an addition of the first available numeral. It is placed in the same folder as the original report.
|
Note You can create duplicates of the reports that are shared with you. The user who creates the duplicate becomes the owner of the duplicate report. |
-
 Subscribe: Set up the automated report delivery. For details refer to Automated report delivery.
 -
 Delete: Delete the report. This action can only be performed by the report owner. Users that the report was shared with will also lose access to the report.
|
Caution Deleting a report is permanent and cannot be undone. A deleted report can only be restored with a backup (exported instance). Take extra care when deleting reports. |
-
 Favorite: Toggles the report as favorite/non-favorite. Refer to Favorites for more details.
 -
 Report Details: Provides details on the last refresh and an option to set an automatic refresh rate. After it has been generated and displayed, the report can be refreshed manually or automatically. If the report designer provided a description of the report, that description will show here.