Reports
Reports are self-contained elements of Reporting. Every report has a defined correlating data model, from which all displayed data is acquired.
Reports are mainly designed for producing printable data displays. The displayed results can be sorted and/or filtered if allowed by the Designer, but more complex interactions are not available. The most common form for these reports is texts and tables. Data visualization elements, such as those used in visual reports, are less commonly used in this kind of report.
Interacting with reports
Reports in Reporting are dedicated to providing printing and print-like data display documents. Their user interaction options are limited to sorting and filtering, and they are available only if the Designer includes them in the report.
The following image displays an example of a standard report in Reporting.

There are multiple pages of data available for viewing. This report also features some graphical elements that help visualize data.
The Filters icon is on the right-hand side of the main screen. If clicked, it hides the Parameters pane, which is open in this image and which allows access to all custom filtering options and other settings for the report. A report Designer must include such options in the report design for this option to be available. The Parameters pane can be minimized to optimize the viewing screen for the elements of the report in the main screen. For more information about report filtering and settings, see Filters & Settings.
The Report Title Bar is located at the top of the report.

It includes the following:
- Report title: To the left of the bar, the same title as in the Reports pane or on a report tile.
- Data model: Located centrally, showing which data model the report is connected to.
- Interaction buttons: Buttons located on the right side of the bar:
-
 Subscribe: Scheduling automated report delivery via designated distribution channels. See Automated report delivery for more details.
 -
 Favorite: Toggles the report as favorite or removes the report from favorites. Adding a report to the Favorites list makes it more easily accessible. See Favorites.
 -
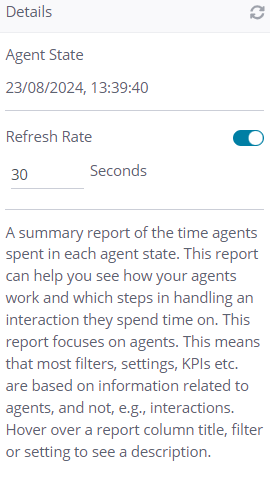
 Report Details: Used to access additional report information in a new window. It provides information on the last refresh time of the report data, as well as the option to set an automatic refresh rate (toggle ON or OFF). It also provides a description of the report (if provided by the report Designer). Clicking the Refresh icon
  in the top right-hand corner of the report details window reloads the complete report, displaying the most recent data available.
Additionally, reports also have the following top menu, shown only once the report is generated:
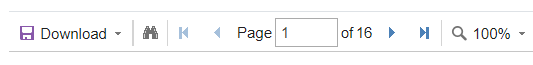
In includes these options:
- Download: Opening this dropdown menu lets you select from a number of formats in which you can download the generated report. This includes formats you cannot edit after download, such as image formats or PDF, as well as formats you can edit after download if needed, such as .doc or .xls. Each format has an additional dialogue window where you can choose the page range you want to export, as well as adjust format-specific settings to suit your needs. Once you have set up all the settings, click OK to start the download.
- Search: Using this tool, you can enter a string you want to find in the report. Clicking this icon opens a new menu under the existing one, containing the search field and additional options.
- Pagination: If the report has multiple pages, use this menu to move between pages, skip to the first or last one, or enter a specific page number you want to see.
- Zoom: Use the integrated zoom function to make the report larger or smaller without affecting the rest of the interface. In the dropdown menu, you can find a set of predefined zoom percentages, or you can use the Page Height or Page Width options to adjust the zoom level so that either the whole report fits the page height or its width.